「Output」の版間の差分
ナビゲーションに移動
検索に移動
| (2人の利用者による、間の3版が非表示) | |||
| 1行目: | 1行目: | ||
<div id="Stardard output of ComplexRI" style="font-size: 150%;"> Stardard output of ComplexRI </div> | <div id="Stardard output of ComplexRI" style="font-size: 150%;"> Stardard output of ComplexRI </div> | ||
---- | ---- | ||
[[File: | [[File:Newoutput.png|750px]] | ||
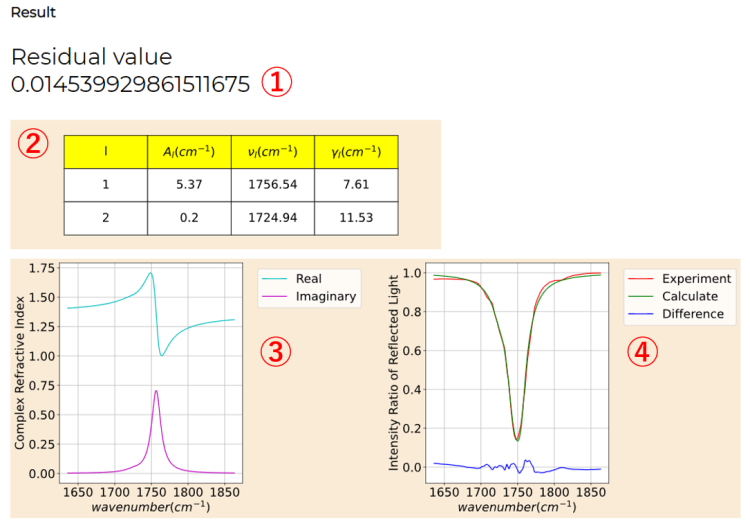
: The standard output results of ComplexRI should be like the above figure. | : The standard output results of ComplexRI should be like the above figure. | ||
: The first line (①) shows the residual value when the fitting is finished. The fitting results are closer to experimental data if this value is small. | : The first line (①) shows the residual value when the fitting is finished. The fitting results are closer to experimental data if this value is small. | ||
| 9行目: | 9行目: | ||
: Part ④ shows the calculated and experimental intensity ratio of reflected light in the target region. The experimental data, obtained from ATR-IR, is shown in red line and the calculated results are shown in green line. The blue line shows the differences between calculated and experimental data. | : Part ④ shows the calculated and experimental intensity ratio of reflected light in the target region. The experimental data, obtained from ATR-IR, is shown in red line and the calculated results are shown in green line. The blue line shows the differences between calculated and experimental data. | ||
<div id="Download your results" style="font-size: 150%;"> Download your results </div> | <div id="Download your results" style="font-size: 150%;"> Download your results </div> | ||
---- | ---- | ||
[[File:DL.png|500px]] | [[File:DL.png|500px]] | ||
: Click the " | : Click the "Download the output file" button to download the output file. | ||
: In the output file, the residual value, table of Lorentz function parameters, and the graphs mentioned above are output. | : In the output file, the residual value, table of Lorentz function parameters, and the graphs mentioned above are output. | ||
: The "Execute another Fitting" button will bring you back to the Main Package page | : The "Execute another Fitting" button will bring you back to the Main Package page with the parameters remaining as you set. | ||
2021年12月25日 (土) 03:07時点における最新版
Stardard output of ComplexRI
- The standard output results of ComplexRI should be like the above figure.
- The first line (①) shows the residual value when the fitting is finished. The fitting results are closer to experimental data if this value is small.
- Part ② shows a table with the final results of the parameters of Lorentz functions. For each Lorentz function used in the fitting, the parameters are listed.
- Part ③ shows the plot of the complex refractive index in the target region, calculated by the Lorentz functions. The blue line is the real part and the purple line is the imaginary part.
- Part ④ shows the calculated and experimental intensity ratio of reflected light in the target region. The experimental data, obtained from ATR-IR, is shown in red line and the calculated results are shown in green line. The blue line shows the differences between calculated and experimental data.
Download your results
- Click the "Download the output file" button to download the output file.
- In the output file, the residual value, table of Lorentz function parameters, and the graphs mentioned above are output.
- The "Execute another Fitting" button will bring you back to the Main Package page with the parameters remaining as you set.


