Theory
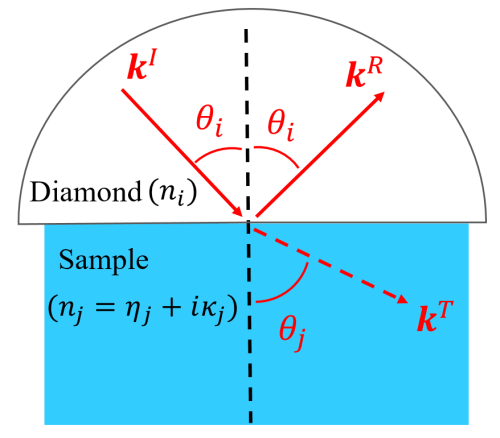
The experimental geometry is described by the two-layer model in the above Figure, where phase and phase represent the substrate and sample, respectively. The incident light in phase and transmitted light in phase are related by Snell's law
where and are the complex refractive index of substrate and sample. and denote the angles of incidence and transmission of IR light, respectively.
The reflectance of - and -polarized lights can be represented as the ratio of reflected to incident light intensities by [1]
The angle of transmission is derived from Snell's law to be
which can be imaginary in the ATR condition.
In the experiment, the incident angle is often fixed, for example, to 45 degree. Take substate diamond as example, is also known as 2.38. Therefore, the ATR condition is satisfied in most cases where is smaller than . This situation is held for most liquid samples. In the total reflection condition, the calculated and are unity when is real. However, and become less than unity when the refractive index of the liquid is complex. The reduced reflectance is a consequence of the absorption of evanescent light in the liquid sample. Therefore, by fitting the experimental reflectance data in ATR-IR spectra, it is able to obtain the complex refractive index of the liquid sample.
The purpose of fitting is to determine the frequency-dependent complex refractive index . The complex refractive index of sample is represented with a set of Lorentz functions
where is the nonresonant refractive index. , and are the amplitude, peak wavenumber and bandwidth of each Lorentz function, respectively. is the number of Lorentz functions to be used. Therefore, the parameters , , and and were determined from the experimental spectra.
In the beginning, should be determined before the fitting procedure. is the nonresonant refractive index in the IR wavenumber region. In the reference paper [2], we use the refractive index values in the visible regions to fit Cauchy's equation.
The obtained parameters were used to evaluate the nonresnant refractive index at 5000 .
It is also possible to directly use the refractive index in the visible region, which may involve a very slight deviation in . [2]
After the determination of , other parameters related to the Lorentz functions are determined by minimizing the least-squares residual (LSR) between the experimental reflectance spectra and those of the analytical formulas over the whole wavenumber region of the target vibrational band. The residual is defined by
where and are the calculated reflectances in the above section. is the experimental reflectance of unpolarized light at wavenumber . The summation of is taken for all observed wavenumber points in the target vibrational band. By minimizing the LSR, the parameters of each Lorentz functions, , and , were obtained. The minimization is numerically done in the program, thus the initial parameter of , , and should be determined. And the initial parameters also have a large effect on whether the minimization can reach the tolerance and how long the minimization procedure is taken. All of them can be set manually. In the following, we will introduce a method to automatically determine the initial parameters.
In order to determine the number of Lorentz functions to be used, we first start with only one Lorentz function and represent the complex refractive index as
The first Lorentz function is used to fit the strongest adsorption band in the target region. Thus, the initial parameter for is set to the wavenumber of minimum value of reflectance in the experimental data. The initial parameter for and are set according to the lineshape of strongest adsorption band in ATR-IR spectra.
After the first fitting procedure, the strongest adsorption band is expected to be well represented. Here if the LSR is less than the tolerance, the fitting is finished and no more Lorentz functions are required. If not, another Lorentz function is added and the complex refractive index become
The second Lorentz funtion is used to represent major adsorption band in the difference reflectance spectra between the first fitting results and experimental results. The initial value of , and are set to be the optimized value in the last fitting procedure. The initial value of is set to the wavenumber of minimum (or maximum) value of difference reflectance spectra. The initial parameter for and is set to be 15 and , respectively. A smaller initial value of suggests that the second Lorentz function is a minor adsorption band in ATR-IR spectra. Then all parameters are again optimized using the same fitting procedure.
The number of Lorentz functions keeps increasing and the whole procedure is repeated until the final LSR reaches the set tolerance.
- ↑ "Theory of Sum Frequency Generation Spectroscopy" Akihiro Morita. Springer Nature Singapore Pte Ltd: 2018
- ↑ 2.0 2.1 "Dispersion of Complex Refractive Indices for Intense Vibrational Bands. I Quantitative Spectra" Ryo Murata, Ken-ichi Inoue, Lin Wang, Shen Ye, and Akihiro Morita, J. Phys. Chem. B, 125(34), 9794-9803 (2021).


![{\displaystyle {\text{LSR}}(\{A_{l},\nu _{l},\Gamma _{l}\})={\frac {1}{n}}\sum _{\nu _{n}\in [\nu _{\text{min}},\nu _{\text{max}}]}\left[|r_{ij}^{p}(\nu _{n})|^{2}+|r_{ij}^{s}(\nu _{n})|^{2}-2|r_{ij}(\nu _{n})|_{\mathrm {exp} }^{2}\right]^{2}}](https://wikimedia.org/api/rest_v1/media/math/render/svg/e5c80359e1c2659c640a48bf58cbfe4cccde4d66)


