「Input」の版間の差分
ナビゲーションに移動
検索に移動
| (2人の利用者による、間の38版が非表示) | |||
| 1行目: | 1行目: | ||
: [[File: | |||
This is the typical snapshot of the input of ComplexRI. Each part will be explained in the following. | |||
: [[File:2Newtoppage.png|1500px]] | |||
: This is the typical snapshot of the input of ComplexRI. | |||
: The input of ComplexRI contains two parts. The left part is the information of ATR-IR experimental data. The right part is the control parameters of the complex refractive index fitting procedure. Each part will be explained in the following. | |||
---- | ---- | ||
<div id=" | <div id="Information of ATR-IR experiment" style="font-size: 200%;"> Information of ATR-IR experiment </div> | ||
---- | ---- | ||
<div id=" | <div id="Input01" style="font-size: 150%;"> ①ATR-IR File </div> | ||
: | : Please upload the ATR-IR experimental data in this part. The inside should be like the following. | ||
: [[File:NewFILE01.png|200px]] | : [[File:NewFILE01.png|200px]] | ||
: | : If there are characters at the beginning of the file, they will be ignored. The columns of wavenumber and ATR-IR data should be separated by space or comma. | ||
: For instance, the csv file exported by ATR-IR can be used. | |||
---- | ---- | ||
<div id="Input03" style="font-size: 150%;"> ③Reflectance or | <div id="Input02" style="font-size: 150%;"> ②The order of data </div> | ||
: | : Please select the sort order of your data. | ||
:: Ascending order: The wavenumbers in the input file are in ascending order (left picture). (Default) | |||
:: Descending order: The wavenumbers in the input file are in descending order (right picture). | |||
:[[File:NewFILE01.png|200px]][[File:NewFILE04.png|220px]] | |||
---- | |||
<div id="Input03" style="font-size: 150%;"> ③Reflectance or Absorbance? </div> | |||
: Please select the type of your ATR-IR data. | |||
:: Reflectance(%): The Reflectance of ATR-IR spectra in the value of percentage. (Default) | :: Reflectance(%): The Reflectance of ATR-IR spectra in the value of percentage. (Default) | ||
:: Reflectance: The Reflectance of ATR-IR spectra. | :: Reflectance: The Reflectance of ATR-IR spectra. | ||
:: | :: Absorbance: The Absorbance of ATR-IR spectra. | ||
: The relationships | : The relationships between each data are | ||
: <math> Reflectance(%)=Reflectance*100 </math> | :: <math> Reflectance(%)=Reflectance*100 </math> | ||
: <math> | :: <math> Absorbance=-\log_{10}(Reflectance) </math> | ||
---- | ---- | ||
<div id="Input04" style="font-size: 150%;"> | <div id="Input04" style="font-size: 150%;"> ④The Substrate in ATR-IR </div> | ||
: | : Please select the substrate you used in the ATR-IR experiment. Here, we prepare the three substrates that often used | ||
: | :: Diamond(Refractive Index = 2.38). (Default) | ||
:: Zinc selenide(Refractive Index = 2.40). | |||
:: Germanium(Refractive Index = 4.0). | |||
: You can also input the refractive index of your substrate by selecting Other in the list. | |||
:[[File:4_other.png|500px]] | |||
---- | ---- | ||
<div id="Input05" style="font-size: 150%;"> ⑤Incident angle in ATR-IR </div> | |||
: Please input the incident angle in your ATR-IR experiment. (Default=45 degree) | |||
<div id=" | ---- | ||
<div id="Input06" style="font-size: 150%;"> ⑥Select the column of your data </div> | |||
: | : Please input the column number of the data that you want to analyze in your ATR-IR file. | ||
:For example, | :: Wavenumber: The column number of wavenumber in your input file. (Default: 1) | ||
:: ATR-IR data: The column number of ATR-IR data in your input file. (Default: 2) | |||
: For example, an input file like following can be uploaded and column 1 and column 5 can be selected for analyzing. | |||
: [[File:NewFILE03.png|500px]] | : [[File:NewFILE03.png|500px]] | ||
: [[File:6_15.png|300px]] | |||
: [[File: | |||
: | ---- | ||
<div id="Control parameters of ComplexRI fitting" style="font-size: 200%;">Control parameters of ComplexRI fitting </div> | |||
---- | ---- | ||
<div id=" | <div id="Input07" style="font-size: 150%;"> ⑦Title of your job </div> | ||
: | : Please input the title of your job (alphabet). The output results of ComplexRI will be saved in the excel format with the name @Title.xlsx | ||
---- | ---- | ||
<div id=" | <div id="Input08" style="font-size: 150%;"> ⑧Input the fitting range </div> | ||
: | : Please input the frequency range (in wavenumber) inside which you want to perform the fitting. ComplexRI will only fit the data inside the range you input here. | ||
:: Minimum wavenumber: The lower boundary of wavenumber. (Default: 1636) | |||
:: Maximum wavenumber: The upper boundary of wavenumber. (Default: 1863) | |||
: | |||
: | |||
: | |||
: | ---- | ||
:[[ | <div id="Input09" style="font-size: 150%;"> ⑨Refractive index of target sample in non-resonance region (<math> n_j^0 </math>) </div> | ||
: Please input the refractive index of the target sample (<math> n_j^0 </math>) in non-resonance region. (Default=1.360) | |||
: A database of common liquids is prepared for reference. The determination of <math> n_j^0 </math> and some comments about it can be found in <u> [[Theory#Fitting procedure| How to Fit the ATR-IR spectra]] </u>. | |||
---- | ---- | ||
<div id=" | <div id="Input10" style="font-size: 150%;"> ⑩The tolerance of fitting </div> | ||
: | : Please input the tolerance of the fitting procedure. (default: 0.02) | ||
: The fitting will be finished when the calculated residual is less than this value. The details are described in <u> [[Theory#Fitting procedure| How to Fit the ATR-IR spectra]] </u>. | |||
:: Note: Try to gradually decrease this value if the fitting results are not close to the experiments. This often happens when fit to the weak adsorption bands. Be careful that fitting can not finish if this value is too small. | |||
:The | |||
: | |||
---- | ---- | ||
<div id="Input11" style="font-size: 150%;"> | <div id="Input11" style="font-size: 150%;"> ⑪ Manually set the initial parameters </div> | ||
: | : Please select whether to set the initial fitting parameters by yourself. | ||
:: No: Automatically done by the algorithm (Default) | |||
:<math>n_j=n_j^0+\sum_{l=1}^{ | :: Yes: Manually set the initial parameters by users. | ||
:The | : In the fitting, we use a set of Lorentz functions to represent the complex refractive index | ||
: [[ | :: <math>n_j=n_j^0+\sum_{l=1}^{l_{max}} \frac{A_l}{\nu_l-\nu-i\gamma_l}</math> | ||
: | : where <math> n_j^0 </math> is input in ⑨. The number of Lorentz functions <math> l_{max} </math>, and the corresponding initial parameters <math> A_l, \nu_l, \gamma_l </math> should be determined. | ||
: | : By selecting <math> No </math>, it means the initial parameters are automatically guessed by the algorithm explained in <u> [[Theory#Auto Fitting| Automatically determine the initial parameters in fitting procedure]] </u>. | ||
: | : By selecting <math> Yes </math>, you can manually set <math> l_{max} </math> and <math> A_l, \nu_l, \gamma_l </math> for each Lorentz function by yourself. The units of <math> A_l, \nu_l, \gamma_l </math> are all wavenumber. <math> l_{max} </math> is up to 5. | ||
: | :: Note: | ||
: [[File: | ::: 1. Automatical mode is recommended when using ComplexRI to fit new data. The results also provide useful information for users to further fitting the data by manual mode. | ||
::: 2. In some cases that users want to fit the vibrational regions with multiple weak adsorption bands, the manual mode might be better to represent the very detailed spectra. | |||
: [[File:11yes.png|500px]] | |||
2022年3月4日 (金) 02:05時点における最新版
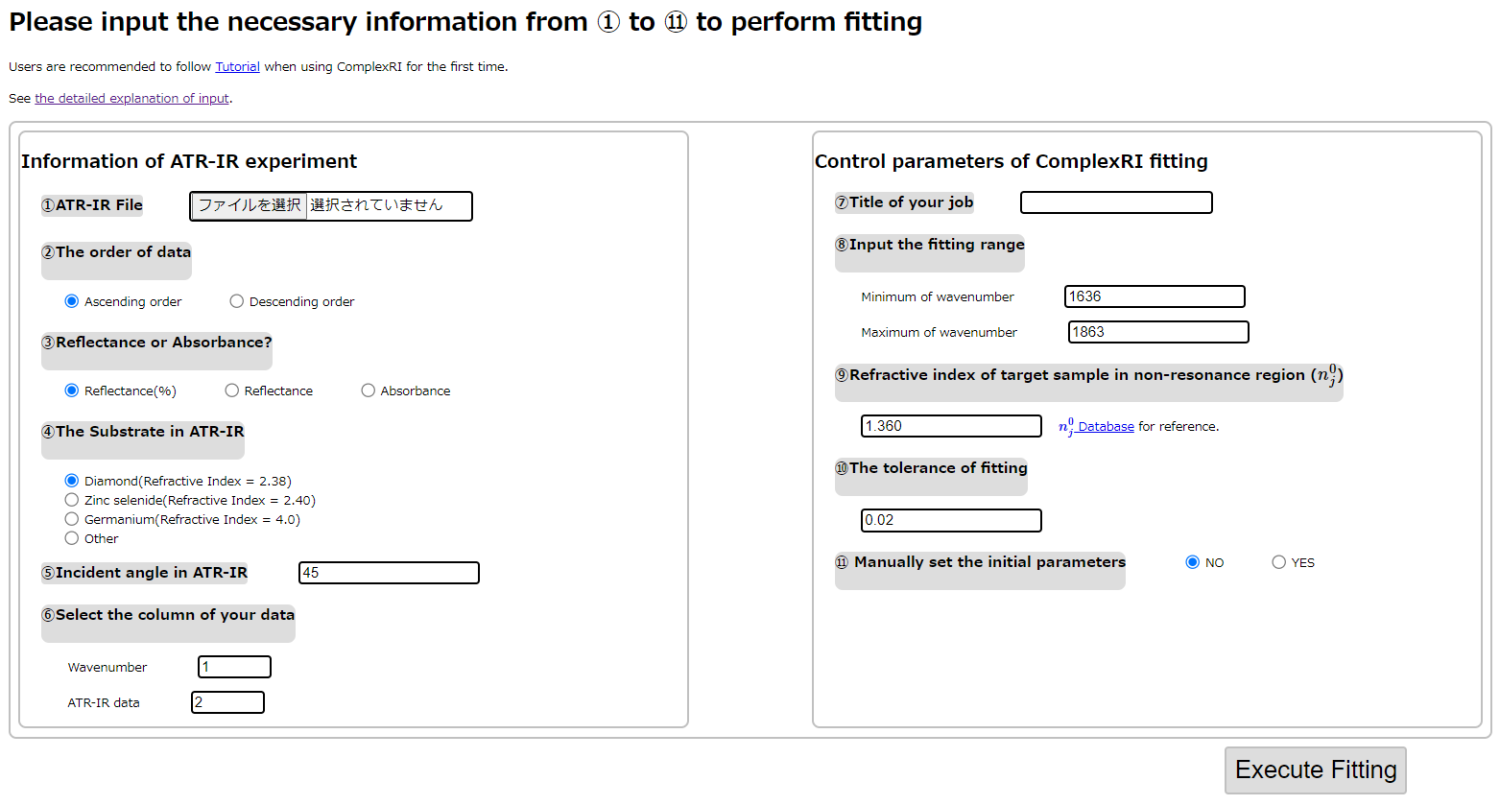
- This is the typical snapshot of the input of ComplexRI.
- The input of ComplexRI contains two parts. The left part is the information of ATR-IR experimental data. The right part is the control parameters of the complex refractive index fitting procedure. Each part will be explained in the following.
Information of ATR-IR experiment
①ATR-IR File
- Please upload the ATR-IR experimental data in this part. The inside should be like the following.
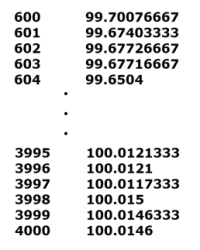
- If there are characters at the beginning of the file, they will be ignored. The columns of wavenumber and ATR-IR data should be separated by space or comma.
- For instance, the csv file exported by ATR-IR can be used.
②The order of data
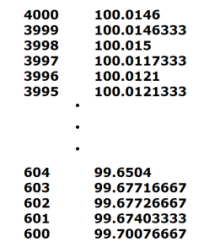
- Please select the sort order of your data.
- Ascending order: The wavenumbers in the input file are in ascending order (left picture). (Default)
- Descending order: The wavenumbers in the input file are in descending order (right picture).

③Reflectance or Absorbance?
- Please select the type of your ATR-IR data.
- Reflectance(%): The Reflectance of ATR-IR spectra in the value of percentage. (Default)
- Reflectance: The Reflectance of ATR-IR spectra.
- Absorbance: The Absorbance of ATR-IR spectra.
- The relationships between each data are
- 構文解析に失敗 (MathML、ただし動作しない場合はSVGかPNGで代替(最新ブラウザーや補助ツールに推奨): サーバー「https://wikimedia.org/api/rest_v1/」から無効な応答 ("Math extension cannot connect to Restbase."):): {\displaystyle Reflectance(%)=Reflectance*100 }
- 構文解析に失敗 (MathML、ただし動作しない場合はSVGかPNGで代替(最新ブラウザーや補助ツールに推奨): サーバー「https://wikimedia.org/api/rest_v1/」から無効な応答 ("Math extension cannot connect to Restbase."):): {\displaystyle Absorbance=-\log_{10}(Reflectance) }
④The Substrate in ATR-IR
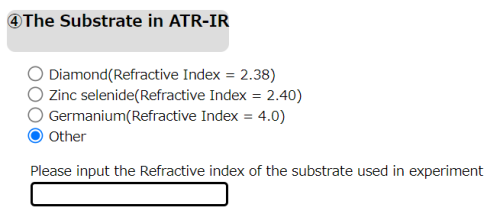
- Please select the substrate you used in the ATR-IR experiment. Here, we prepare the three substrates that often used
- Diamond(Refractive Index = 2.38). (Default)
- Zinc selenide(Refractive Index = 2.40).
- Germanium(Refractive Index = 4.0).
- You can also input the refractive index of your substrate by selecting Other in the list.
⑤Incident angle in ATR-IR
- Please input the incident angle in your ATR-IR experiment. (Default=45 degree)
⑥Select the column of your data
- Please input the column number of the data that you want to analyze in your ATR-IR file.
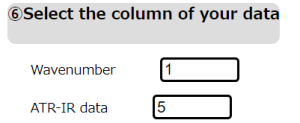
- Wavenumber: The column number of wavenumber in your input file. (Default: 1)
- ATR-IR data: The column number of ATR-IR data in your input file. (Default: 2)
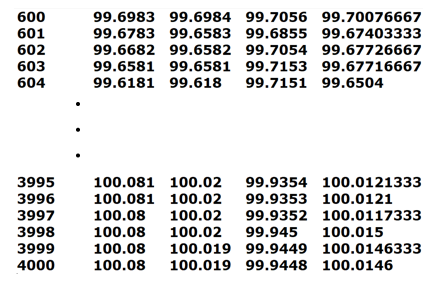
- For example, an input file like following can be uploaded and column 1 and column 5 can be selected for analyzing.
Control parameters of ComplexRI fitting
⑦Title of your job
- Please input the title of your job (alphabet). The output results of ComplexRI will be saved in the excel format with the name @Title.xlsx
⑧Input the fitting range
- Please input the frequency range (in wavenumber) inside which you want to perform the fitting. ComplexRI will only fit the data inside the range you input here.
- Minimum wavenumber: The lower boundary of wavenumber. (Default: 1636)
- Maximum wavenumber: The upper boundary of wavenumber. (Default: 1863)
⑨Refractive index of target sample in non-resonance region (構文解析に失敗 (MathML、ただし動作しない場合はSVGかPNGで代替(最新ブラウザーや補助ツールに推奨): サーバー「https://wikimedia.org/api/rest_v1/」から無効な応答 ("Math extension cannot connect to Restbase."):): {\displaystyle n_j^0 }
)
- Please input the refractive index of the target sample (構文解析に失敗 (MathML、ただし動作しない場合はSVGかPNGで代替(最新ブラウザーや補助ツールに推奨): サーバー「https://wikimedia.org/api/rest_v1/」から無効な応答 ("Math extension cannot connect to Restbase."):): {\displaystyle n_j^0 } ) in non-resonance region. (Default=1.360)
- A database of common liquids is prepared for reference. The determination of 構文解析に失敗 (MathML、ただし動作しない場合はSVGかPNGで代替(最新ブラウザーや補助ツールに推奨): サーバー「https://wikimedia.org/api/rest_v1/」から無効な応答 ("Math extension cannot connect to Restbase."):): {\displaystyle n_j^0 } and some comments about it can be found in How to Fit the ATR-IR spectra .
⑩The tolerance of fitting
- Please input the tolerance of the fitting procedure. (default: 0.02)
- The fitting will be finished when the calculated residual is less than this value. The details are described in How to Fit the ATR-IR spectra .
- Note: Try to gradually decrease this value if the fitting results are not close to the experiments. This often happens when fit to the weak adsorption bands. Be careful that fitting can not finish if this value is too small.
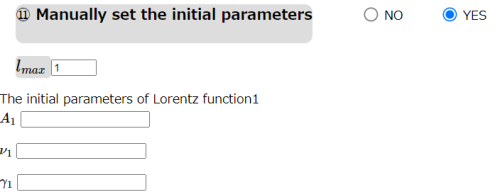
⑪ Manually set the initial parameters
- Please select whether to set the initial fitting parameters by yourself.
- No: Automatically done by the algorithm (Default)
- Yes: Manually set the initial parameters by users.
- In the fitting, we use a set of Lorentz functions to represent the complex refractive index
- 構文解析に失敗 (MathML、ただし動作しない場合はSVGかPNGで代替(最新ブラウザーや補助ツールに推奨): サーバー「https://wikimedia.org/api/rest_v1/」から無効な応答 ("Math extension cannot connect to Restbase."):): {\displaystyle n_j=n_j^0+\sum_{l=1}^{l_{max}} \frac{A_l}{\nu_l-\nu-i\gamma_l}}
- where 構文解析に失敗 (MathML、ただし動作しない場合はSVGかPNGで代替(最新ブラウザーや補助ツールに推奨): サーバー「https://wikimedia.org/api/rest_v1/」から無効な応答 ("Math extension cannot connect to Restbase."):): {\displaystyle n_j^0 } is input in ⑨. The number of Lorentz functions 構文解析に失敗 (MathML、ただし動作しない場合はSVGかPNGで代替(最新ブラウザーや補助ツールに推奨): サーバー「https://wikimedia.org/api/rest_v1/」から無効な応答 ("Math extension cannot connect to Restbase."):): {\displaystyle l_{max} } , and the corresponding initial parameters 構文解析に失敗 (MathML、ただし動作しない場合はSVGかPNGで代替(最新ブラウザーや補助ツールに推奨): サーバー「https://wikimedia.org/api/rest_v1/」から無効な応答 ("Math extension cannot connect to Restbase."):): {\displaystyle A_l, \nu_l, \gamma_l } should be determined.
- By selecting 構文解析に失敗 (MathML、ただし動作しない場合はSVGかPNGで代替(最新ブラウザーや補助ツールに推奨): サーバー「https://wikimedia.org/api/rest_v1/」から無効な応答 ("Math extension cannot connect to Restbase."):): {\displaystyle No } , it means the initial parameters are automatically guessed by the algorithm explained in Automatically determine the initial parameters in fitting procedure .
- By selecting 構文解析に失敗 (MathML、ただし動作しない場合はSVGかPNGで代替(最新ブラウザーや補助ツールに推奨): サーバー「https://wikimedia.org/api/rest_v1/」から無効な応答 ("Math extension cannot connect to Restbase."):): {\displaystyle Yes }
, you can manually set 構文解析に失敗 (MathML、ただし動作しない場合はSVGかPNGで代替(最新ブラウザーや補助ツールに推奨): サーバー「https://wikimedia.org/api/rest_v1/」から無効な応答 ("Math extension cannot connect to Restbase."):): {\displaystyle l_{max} }
and 構文解析に失敗 (MathML、ただし動作しない場合はSVGかPNGで代替(最新ブラウザーや補助ツールに推奨): サーバー「https://wikimedia.org/api/rest_v1/」から無効な応答 ("Math extension cannot connect to Restbase."):): {\displaystyle A_l, \nu_l, \gamma_l }
for each Lorentz function by yourself. The units of 構文解析に失敗 (MathML、ただし動作しない場合はSVGかPNGで代替(最新ブラウザーや補助ツールに推奨): サーバー「https://wikimedia.org/api/rest_v1/」から無効な応答 ("Math extension cannot connect to Restbase."):): {\displaystyle A_l, \nu_l, \gamma_l }
are all wavenumber. 構文解析に失敗 (MathML、ただし動作しない場合はSVGかPNGで代替(最新ブラウザーや補助ツールに推奨): サーバー「https://wikimedia.org/api/rest_v1/」から無効な応答 ("Math extension cannot connect to Restbase."):): {\displaystyle l_{max} }
is up to 5.
- Note:
- 1. Automatical mode is recommended when using ComplexRI to fit new data. The results also provide useful information for users to further fitting the data by manual mode.
- 2. In some cases that users want to fit the vibrational regions with multiple weak adsorption bands, the manual mode might be better to represent the very detailed spectra.
- Note:
